
How to Read a Survey Map: Key Symbols, Coordinates, and Tips
Survey maps might seem like a jumble of lines and symbols at first glance, but they hold the key to understanding the lay of the land. Whether you're a hiker planning your next adventure, a real estate agent assessing property lines, or a developer plotting a new project, knowing how to read these maps is invaluable.
In this article, we'll demystify the essential symbols, coordinates, and techniques for interpreting survey maps, turning you into a map-reading pro. From contour lines to coordinate systems, get ready to unlock the secrets of the landscape and make informed decisions with confidence.
What Is A Survey Map?
A survey map is a detailed representation of a specific area, illustrating the land's features, boundaries, and dimensions. It is created through the process of surveying, which involves measuring and mapping the land to establish accurate property lines and document topographical details. Survey maps are essential tools in various fields such as construction, real estate, and land development, providing critical information for decision-making and legal documentation.
Surveying involves various tools and techniques, such as digital levels, Global Navigation Satellite System (GNSS) devices, and total stations like the Trimble S5 2 Second Robotic, to measure angles and distances accurately. These tools help in creating precise maps that reflect the terrain's true characteristics. For example, GNSS devices provide exact coordinates for mapping, while digital levels help perform advanced and automatic height calculations during land surveying.
Survey maps ensure precise land division, help resolve boundary disputes, and assist in planning infrastructure projects. By integrating both natural and man-made features, survey maps offer a comprehensive overview that supports efficient land management and development.
In real-world scenarios, they are used to design roads, plan urban developments, and assess environmental impacts, making them indispensable in both public and private sectors.
What Are The Key Symbols On A Survey Map?
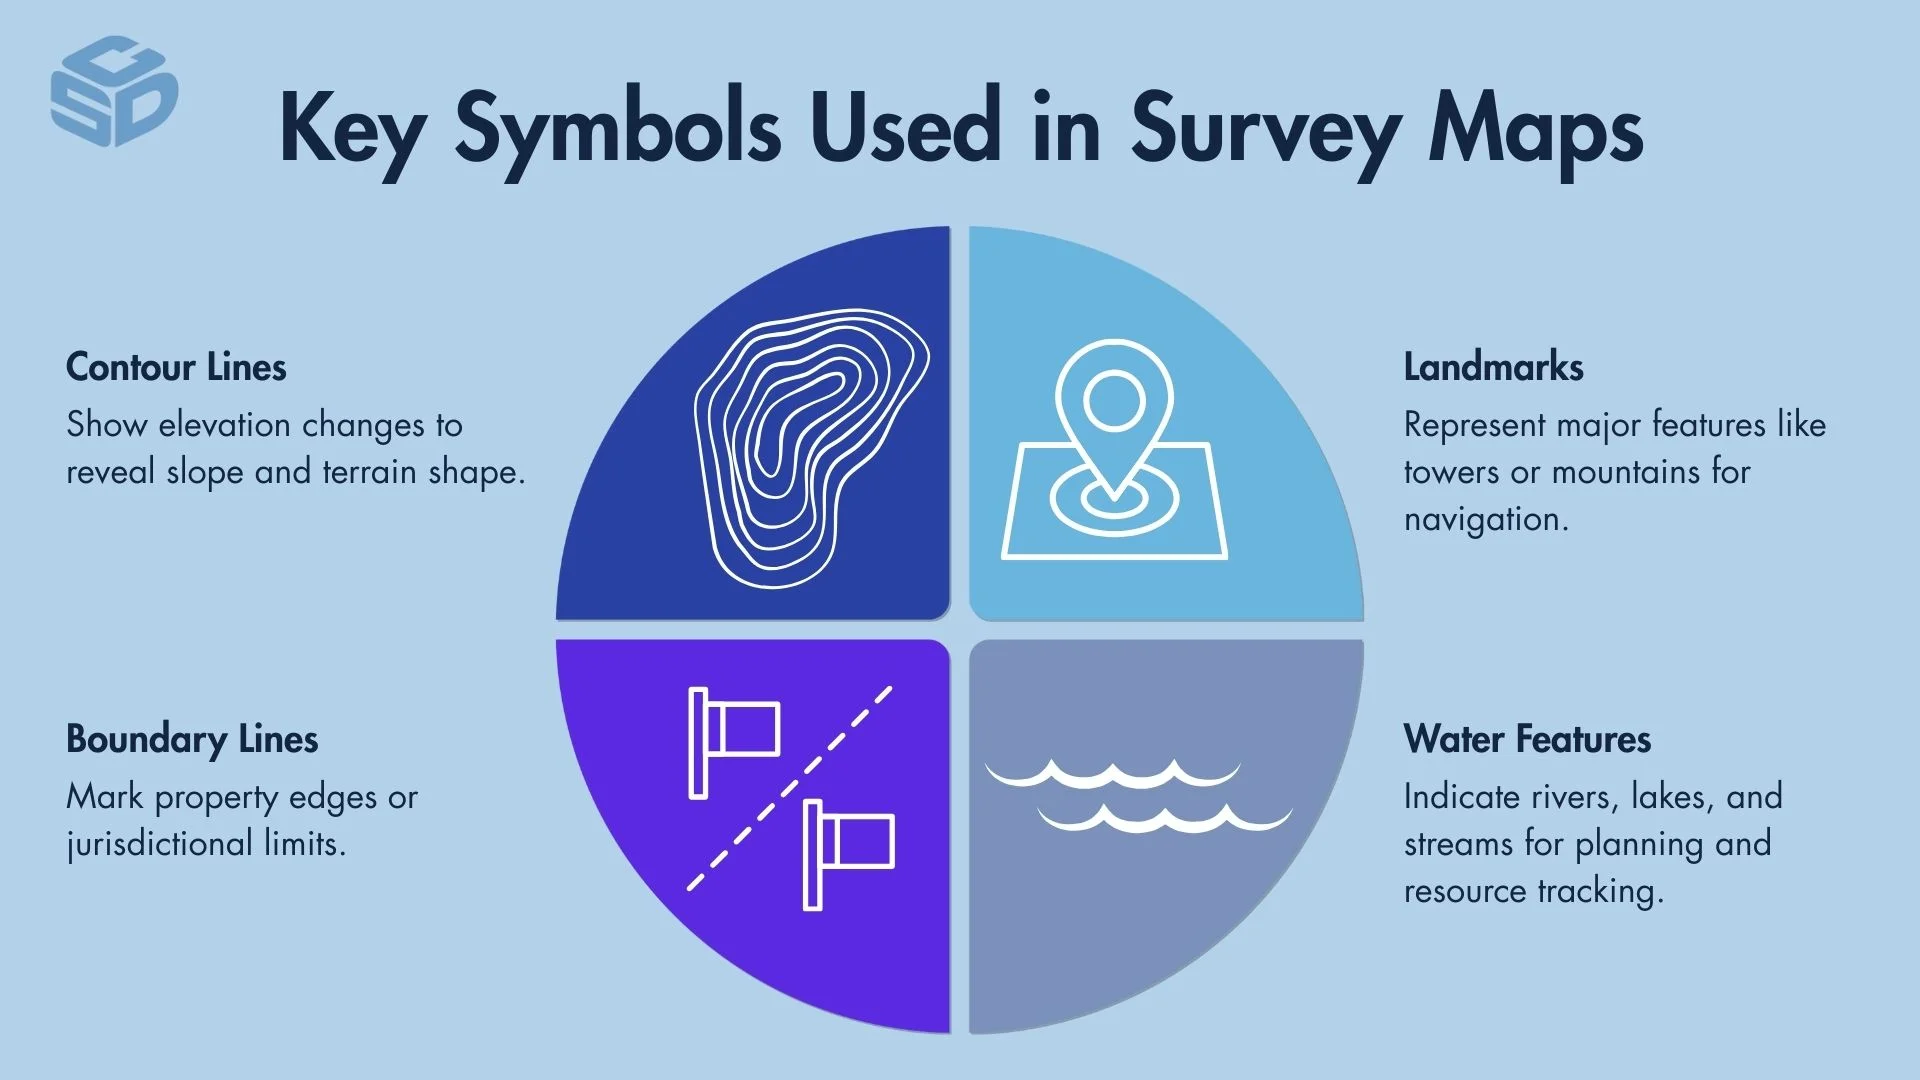
Survey maps utilize key symbols to convey crucial information about the land. These symbols include contour lines, boundary lines, landmarks, and water features. Contour lines indicate changes in elevation, helping to visualize the terrain's slope.
Boundary lines define property or jurisdiction limits, essential for legal and planning purposes. Landmarks highlight significant natural or man-made features, aiding in navigation and orientation. Water features such as rivers, lakes, and streams are represented to provide insights into the area's hydrology.
Understanding these symbols is vital for accurately interpreting survey maps and making informed decisions based on the depicted landscape.
Types of symbols: contour lines, boundary lines, landmarks, water features
Survey maps use a variety of symbols to convey essential details about the terrain. The primary types include contour lines, boundary lines, landmarks, and water features.
| Symbol Type | Description | Examples | Practical Uses |
| Contour Lines | Indicate changes in elevation, showing the terrain's slope. | Lines that are close together indicate steep slopes; lines that are far apart indicate gentle slopes. | Used in construction planning to assess land suitability, in hiking to plan routes, and in environmental studies to understand terrain. |
| Boundary Lines | Define property or jurisdiction limits. | Solid or dashed lines marking the edges of properties or jurisdictions. | Essential for legal clarity in real estate transactions, infrastructure development, and resolving boundary disputes. |
| Landmarks | Identify significant natural or man-made features. | Symbols for mountains, towers, or historical sites. | Aid in navigation by providing reference points, used in urban planning and tourism. |
| Water Features | Represent bodies of water such as rivers, lakes, and streams. | Blue lines or shapes indicating rivers, lakes, and streams. | Important for environmental management, planning recreational activities, and assessing water resources. |
How Do You Interpret Contour Lines?
Interpreting contour lines on a survey map involves understanding how they represent elevation changes. By examining the spacing between these lines, you can determine the steepness of the terrain; closely spaced lines indicate steep slopes, while widely spaced lines suggest gentle slopes.
Additionally, reading contour intervals, which are the vertical distances between lines, helps in calculating elevation differences between points. This understanding is crucial for activities like land navigation and planning, as it allows users to visualize the topography and make informed decisions based on the landscape's physical characteristics.
Reading contour intervals: understanding elevation differences
Contour intervals represent the vertical distances between contour lines on a map in feet/meters. Grasping these intervals is crucial for determining elevation differences between points on the terrain. For example, if the contour interval is 10 feet, and there are five contour lines between two points, the elevation difference is at least 50 feet.
This calculation is vital for route planning in hiking, where understanding elevation changes can help in assessing the difficulty of a trail, or in construction planning, where it aids in determining the feasibility of building on a particular slope.
Identifying slopes: steep vs. gentle
The spacing of contour lines is key to identifying the slope of the terrain. Closely spaced lines indicate a steep slope, suggesting a rapid elevation change over a short distance. In contrast, widely spaced lines denote a gentle slope, where elevation changes occur more gradually.
Recognizing these patterns enhances navigation and planning, enabling users to anticipate and prepare for the physical challenges of the landscape. For instance, a hiker can use this information to choose a less strenuous path, while a developer might assess the suitability of a site for construction based on the slope's steepness.
What Are Map Coordinates And How Are They Used?
Map coordinates are numerical values that define precise locations on a map, essential for pinpointing exact positions and navigating the terrain accurately.
Common types include latitude and longitude, which provide a global positioning framework, and the Universal Transverse Mercator (UTM) system, which offers detailed mapping for specific areas. Grid references are also used for local navigation, offering a simplified method for finding locations.
Understanding these coordinates is crucial for activities like hiking, land surveying, and property assessment, as they facilitate efficient navigation and ensure accurate location tracking.
Types of coordinates: latitude and longitude, state plane coordinates, local grid coordinates
Map coordinates are available in various forms, each tailored to different navigation and mapping requirements. The primary types include latitude and longitude,state plane coordinates, and local grid coordinates.
| Coordinate System | Description | Applications | Advantages |
| Latitude and Longitude | Angular measurements from the equator and prime meridian. | Global navigation, GNSS devices, mapping applications. | Universal method for pinpointing any location on Earth. |
| State Plane Coordinates | A set of coordinate systems defined for specific U.S. states and regions, using either transverse Mercator or Lambert conformal conic projections. | Engineering projects, cadastral mapping, public works. | Highly accurate over small regions; tailored to minimize distortion for each state. |
| Local Grid Coordinates | Custom coordinate systems created for use in small-scale projects or local areas. | Construction sites, mine surveying, municipal mapping. | Easily adapted to project-specific needs; simplifies calculations and on-site use. |
How Do You Find Your Location On A Survey Map?
Finding your location on a survey map involves using both visible landmarks and map coordinates. By cross-referencing landmarks such as distinct natural or man-made features visible in your surroundings with their representations on the map, you can approximate your position. Additionally, employing coordinates such as latitude and longitude or UTM allows for pinpointing your exact location.
This dual approach enhances navigation accuracy, ensuring you can orient yourself effectively, whether for outdoor activities, land surveying, or property assessment.

Using landmarks: cross-referencing visible features
To find your location on a survey map, start by using landmarks. Identify distinct natural or man-made features in your surroundings and cross-reference them with their representations on the map. For example, if you see a large hill and a river nearby, locate these features on the map to approximate your position.
This method helps you match visible features with map symbols, enhancing your spatial awareness and navigation accuracy.
Employing coordinates: pinpointing exact positions
For a more precise location, employ coordinates such as latitude and longitude or UTM. Use a GNSS device to obtain your current coordinates and locate them on the map. For instance, if your GNSS device indicates a latitude of 34.0522° N and a longitude of 118.2437° W, find this point on the map to determine your exact position.
By combining this method with landmark cross-referencing, you can achieve a comprehensive understanding of your location for various activities like hiking, surveying, or property assessment.
What Tools Can Assist In Reading A Survey Map?
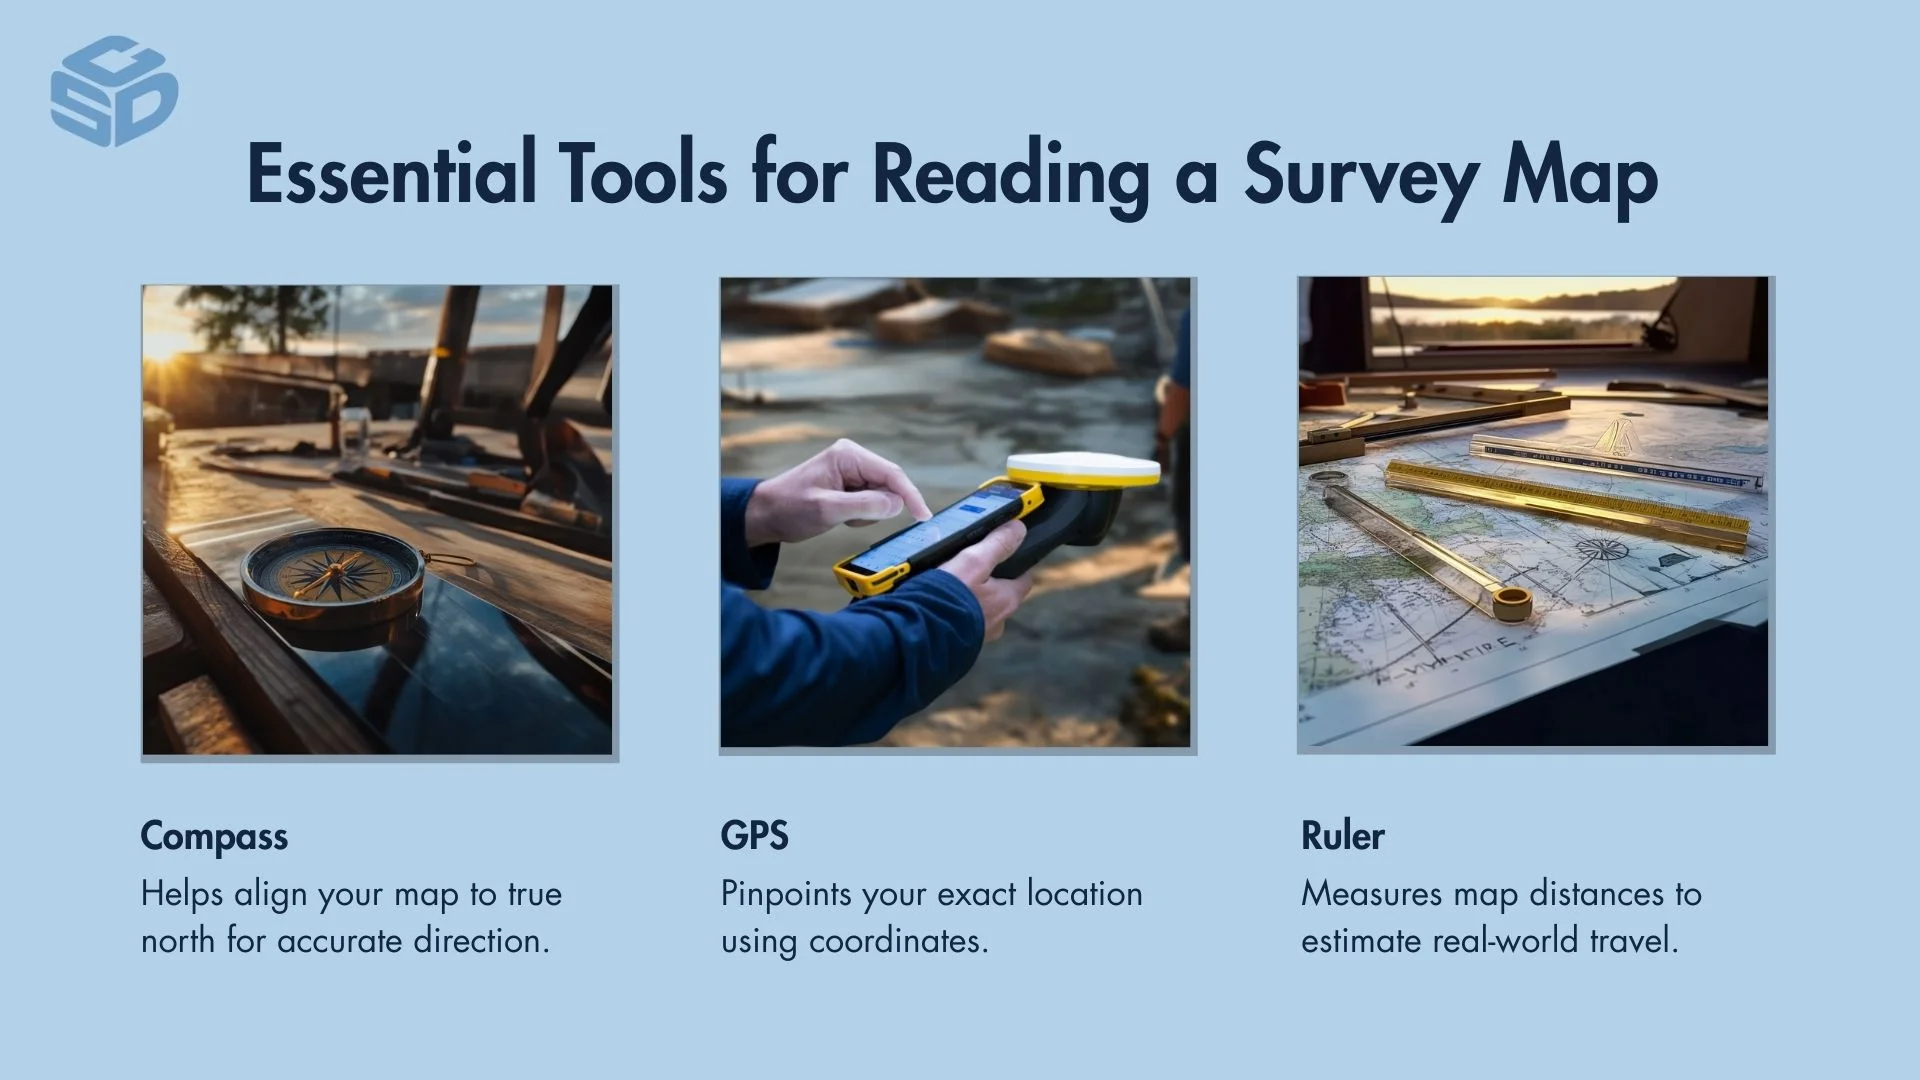
Several tools can significantly enhance your ability to read and interpret a survey map. A compass is essential for direction finding, helping you align the map with the terrain. A GNSS device provides precise location tracking, allowing for accurate navigation and positioning. Many surveyors take GNSS location data and use GIS tools such as the Trimble TDC6 Handheld Data Collector for organized mapping.
Additionally, a ruler is useful for measuring distances on the map, aiding in the calculation of real-world distances. These tools, when used together, improve your map-reading skills and ensure efficient navigation and planning, whether for outdoor activities, land surveying, or property assessment.
Tools: Compass, GNSS, Ruler/Scale Device
To effectively read a survey map, several tools can be utilized, including a compass, GNSS, and ruler/scale device. Below is a detailed markdown table illustrating how each tool is used in practice and tips for choosing the right tools for specific activities:
| Tool | Function | Practical Use Example | Tips for Choosing the Right Tool |
| Compass | Direction finding | Align the map with the terrain by orienting it to true north using a compass. | Choose a compass with a clear baseplate and rotating bezel for easy map alignment. |
| GNSS | Precise location tracking. | Use GNSS to obtain exact coordinates, ensuring accurate navigation on unfamiliar trails. | Opt for a GNSS device with a long battery life and preloaded topographic maps for outdoor activities. |
| Ruler/scale device | Measuring distances on the map. | Measure the distance between two points on the map to calculate real-world distances. | Select a ruler with both metric and imperial units for versatility in different mapping scenarios. |
By integrating these tools, users can enhance their map-reading capabilities, ensuring accurate navigation and effective planning across various applications.
What Are Some Tips For Effectively Reading A Survey Map?
Effectively reading a survey map involves familiarizing yourself with the map's legend to understand symbols and scales. Regular practice is essential to improve your map-reading skills, allowing you to interpret the map quickly and accurately. By becoming proficient in identifying key features and using tools like a compass and GNSS, you can enhance your navigation abilities.
These skills are crucial for various applications, including outdoor adventures, land surveying, and property assessment, ensuring you can make informed decisions based on the map's information.
Familiarize with the legend: understanding symbols and scales
To effectively read a survey map, it's essential to familiarize yourself with the legend. The legend deciphers the map's symbols and scales, providing critical insights into the terrain's features and dimensions. Understanding these elements ensures accurate interpretation and application of the map's information.
Practice regularly: improving map-reading skills
Regular practice is key to honing your map-reading skills. Engage in exercises like plotting routes on a map, identifying elevation changes, and using coordinates to locate specific points. Practice scenarios such as planning a hiking trip or assessing a property's boundaries to build proficiency.
This continuous practice builds confidence and proficiency, enabling you to make informed decisions in various scenarios, from outdoor activities to professional surveying.
How Can Understanding A Survey Map Benefit Outdoor Activities?
Understanding a survey map significantly enhances outdoor activities by providing detailed insights into the terrain. For hiking, it aids in planning routes and avoiding hazards, ensuring a safe and enjoyable experience. In land navigation, it facilitates efficient travel and exploration by offering precise location tracking and direction finding.
For property assessment, it helps in determining land boundaries and features, enabling informed decisions about land use and management. Mastery of survey maps empowers outdoor enthusiasts to navigate confidently and make strategic choices based on the landscape's characteristics.
Activities: hiking, land navigation, property assessment
Understanding survey maps is invaluable for various activities such as hiking, land navigation, and property assessment. Below is a table illustrating how survey maps can be applied in these activities:
| Activity | Application of Survey Maps |
| Hiking |
|
| Land Navigation |
|
| Property Assessment |
|
Hiking: planning routes and avoiding hazards
For hiking, a survey map aids in planning routes by highlighting trails, elevation changes, and potential hazards. This knowledge helps hikers choose safe paths and prepare adequately for the terrain, enhancing both safety and enjoyment.
Land navigation: efficient travel and exploration
In land navigation, survey maps facilitate efficient travel and exploration. They provide precise location tracking and direction finding, allowing explorers to navigate unfamiliar landscapes with confidence and efficiency.
Property assessment: determining land boundaries and features
For property assessment, survey maps are often combined with data collection devices like the Trimble TSC5 Data Collector, as they are crucial in determining land boundaries and identifying features. This information supports informed decisions about land use, management, and development, ensuring clarity and precision in property-related activities.